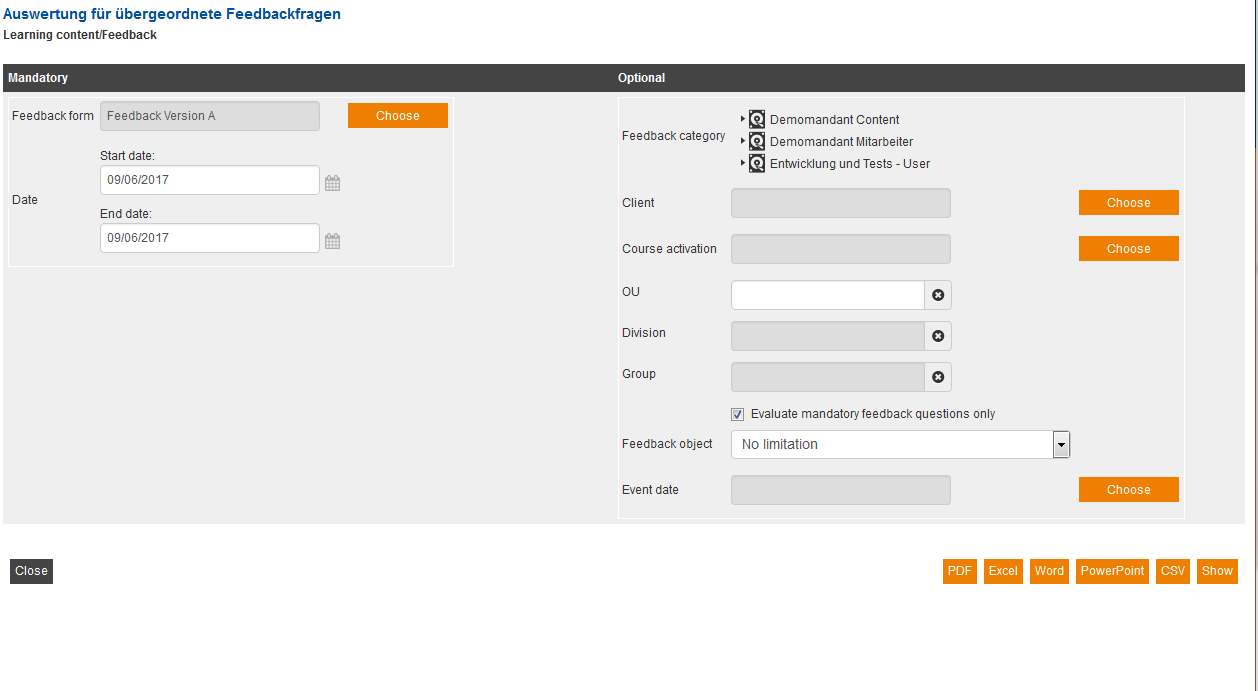
This report shows you the average answers users selected for the overall results of the mandatory questions in a feedback form. In addition, it shows the comments and the frequency of the users’ answers. The results apply to other feedback forms as well.
Mandatory
First choose a feedback for getting a collection of feedback questions. This step is mandatory, because you can’t choose multiple mandatory feedback questions simultaneous in another way. But the evaluation is cross-feedback.
Optional
For improving the evaluation you can set various filters for limiting the data:
Feedback category
Choose a category in the category tree for limiting the evaluation on the feedbacks of this category (and sub categories).
Course activation/ Client/ OU/ Division/ Group
If the same feedback is used in multiple lerning units, you can choose a definite element for getting a specific evaluation.
Evaluate mandatory feedback questions only
This check box isn’t set by default. Then the evaluation will be performed for all feedback questions of the chosen object.
If you set this check box, only the mandatory feedback questions will be evaluated.
Feedback object
Limit the evaluation of the feedback to one feedback object. These objects will be stored directly in the feedback (See feedbacks). You can freely choose definitions like locations and you can choose person-feedback objects.
Date/ Event date
You can limit with these optional filters the evaluation of a feedback by time.
The course “Space trip” is finished by filling out a feedback form.
- For the report you choose the feedback of the course “Space trip”.
- The feedback contains the following feedback questions:
- Mandatory feedback question: “How did you like the structure of the course?”
- Feedback question 1: “On which topics you want further instructions?”
- Feedback question 2: “Where did your instruction did take place?”
Note: The check box “Evaluate mandatory feedback questions only” is set.
The report shows:
all answers, which were given to the mandatory feedback question “How did you like the structure of the course?”, even the answers, which are given to this mandatory question in the feedbacks of the course “Apparal and equipment”.
Example for a report
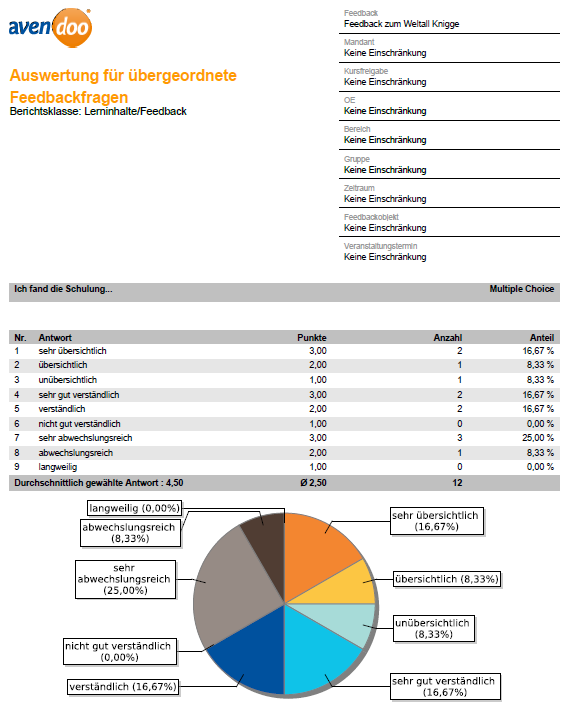
The report shows you first the data, which you have chosen in the filter settings: Feedback, client, course activation, OU, division, group, time period, feedback object and event date. In the first grey-shaded line you see the title of the feedback question on the left side and the answer type on the right side. Below you see a listing of the evaluated feedback questions and a graphical overview as pie chart.
N0.
Shows the order of the potential answers of the chosen feedback question.
Answer
Shows the potential answers for the chosen feedback question.
Points
Shows the number of points, for which the respective potential answer is determined. For further information see learning content → feedback questions.
Number
Represents the number how often the potential answer was chosen. At the end of the column you find the total ( Σ ) of the made answers.
Share
Represents the number how often a potential answer was chosen in percentage.


