Inhalte
- 1 Reports
- 2 Report favorites
- 3 Report templates
- 4 Training inventory
- 5 Report categories of the static reports
- 6 Quicklinks – Course assistance
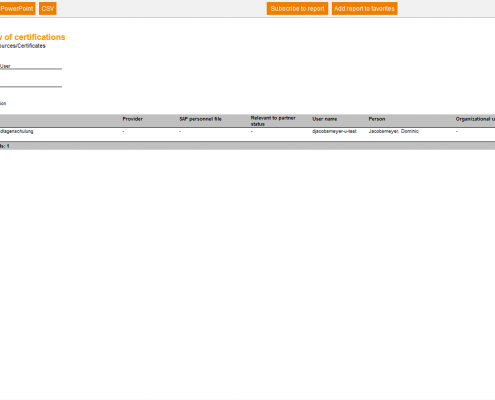
- 6.1 Total overview of the certifications
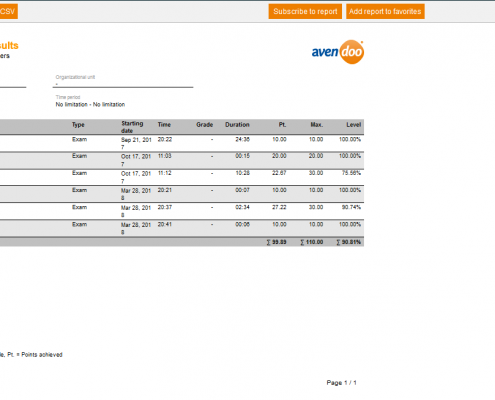
- 6.2 Test and assessment results
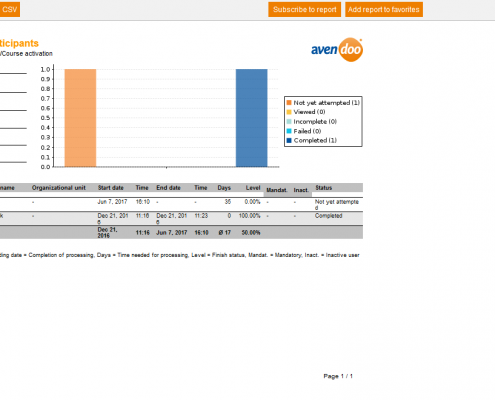
- 6.3 Statistics on course participants
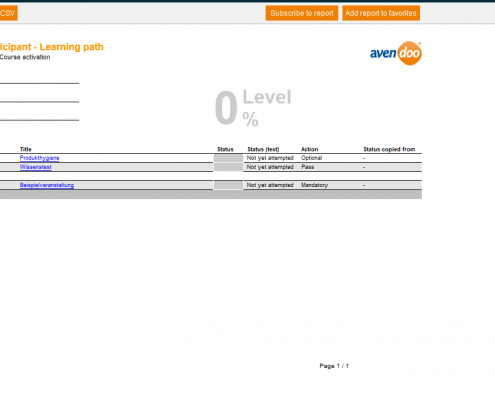
- 6.4 Statistics on course participant – Learning path
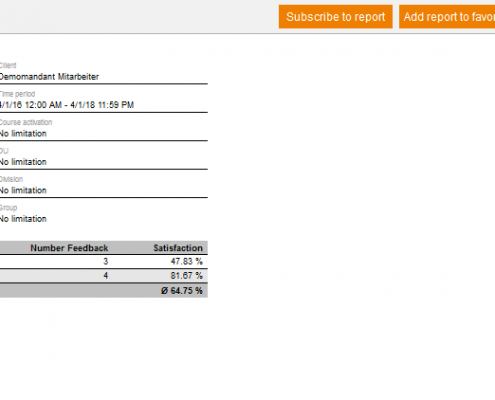
- 6.5 Satisfaction of the course participants
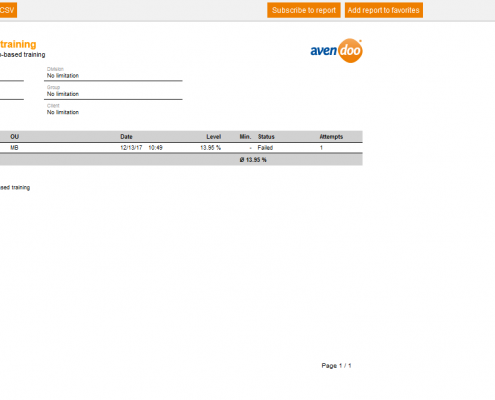
- 6.6 Results from web-based training
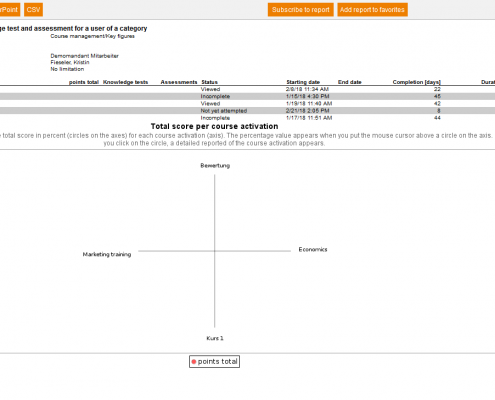
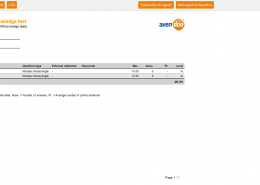
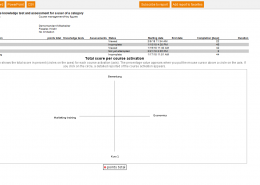
- 6.7 Results for the knowledge test and assessment for a user of a category
- 6.8 Rankings for a knowledge test
- 6.9 Participants’ question results
- 6.10 Participants’ dynamic question results for a course activation
- 6.11 Overview of conducted knowledge tests
- 6.12 Matrix – Participants x learning path Lite
- 6.13 Matrix – Participants x learning path
- 6.14 Learning time per course participant
- 6.15 KPI: Satisfied participants
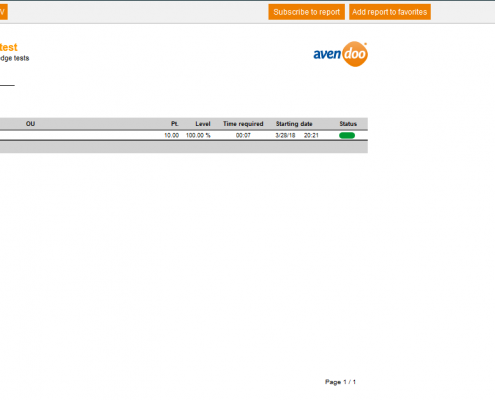
- 6.16 Knowledge-test results
- 6.17 Files of the participants
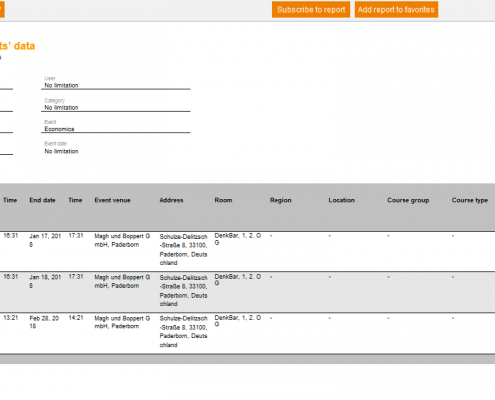
- 6.18 Event dates with participants’ data
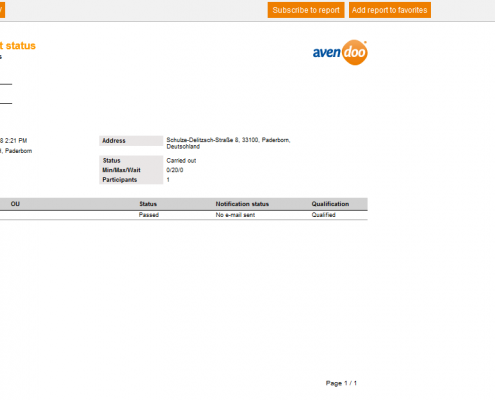
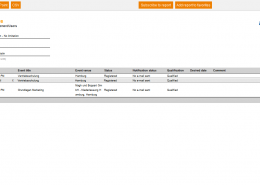
- 6.19 Event dates with participant status
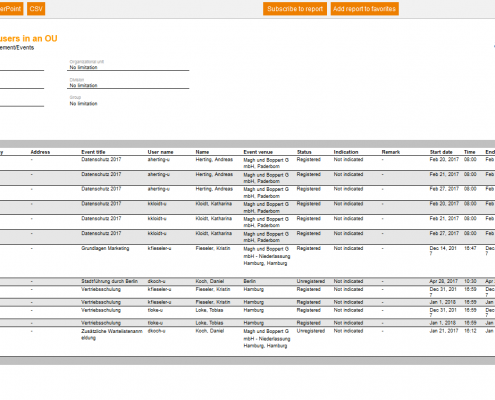
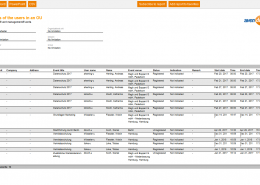
- 6.20 Event dates of the users in an OU
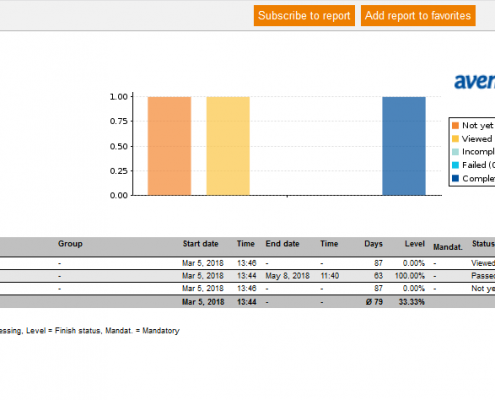
- 6.21 Course participant statistics (expanded)
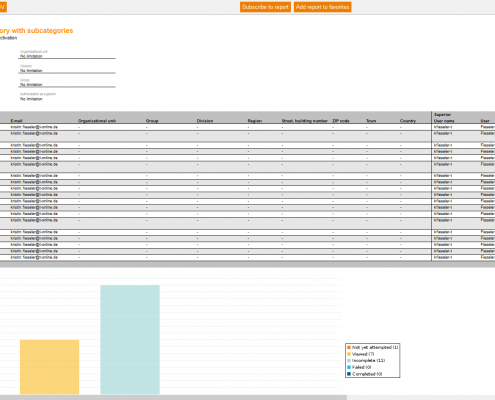
- 6.22 Course activations for a category with subcategories
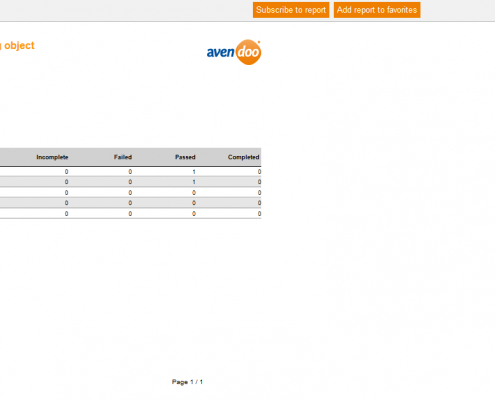
- 6.23 Course activation – participant status per learning object
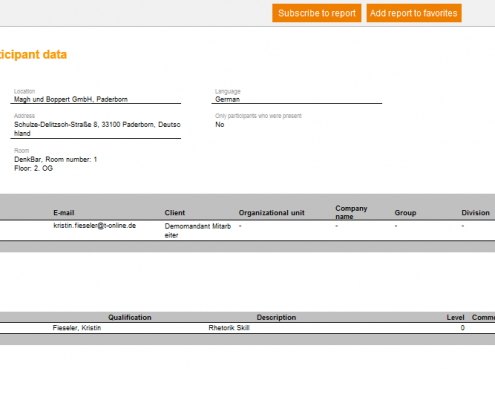
- 6.24 Attendance list with extended participant data
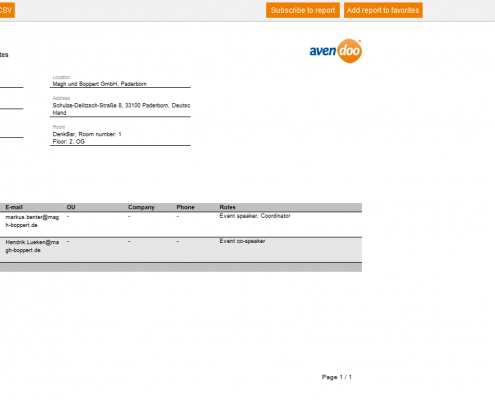
- 6.25 Attendance list
- 6.26 Assessment results
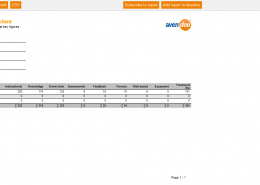
- 6.27 Assessment of course participants’ total details
- 6.28 Anonymized matrix- participants x learning path
- 6.29 A user’s certifications
- 7 Quicklinks – Quality Assurance of the content
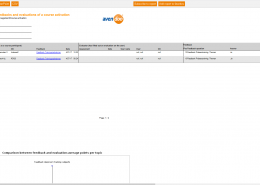
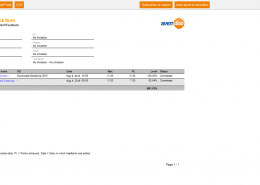
- 7.1 Comparison of feedbacks and evaluations of a course activation
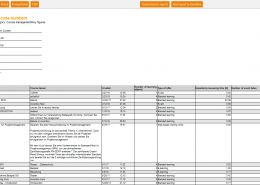
- 7.2 Course code numbers
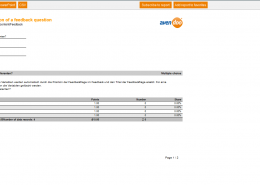
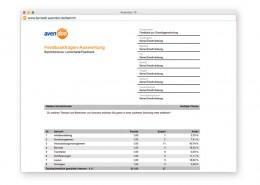
- 7.3 Detailed evaluation of a feedback question
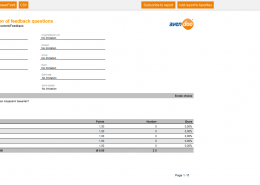
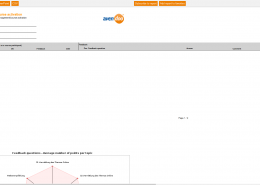
- 7.4 Detailed evaluation of feedback questions
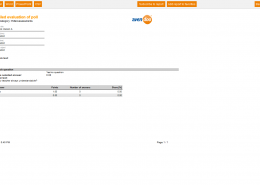
- 7.5 Detailed evaluation of poll
- 7.6 Dynamic processing status of instructional material
- 7.7 Dynamic quality check – knowledge test
- 7.8 Evaluation for mandatory feedback questions
- 7.9 Evaluation of feedback questions
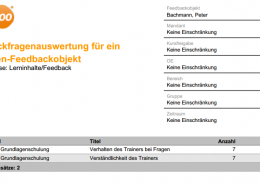
- 7.10 Evaluation of feedback questions for a feedback object on people
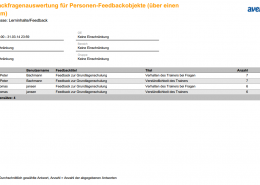
- 7.11 Evaluation of feedback questions for feedback objects on people (over a given time period)
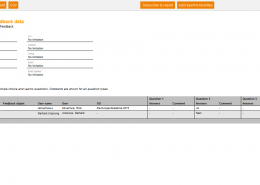
- 7.12 Feedback on a course activation
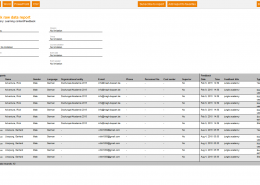
- 7.13 Feedback raw data report
- 7.14 Feedback received as event speaker
- 7.15 Feedback received on event speaker
- 7.16 KPI: Satisfied participants
- 7.17 Quality check on knowledge test
- 7.18 Result for a feedback form
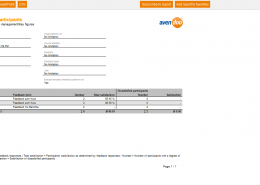
- 7.19 Total evaluation of feedback data
- 7.20 Use figures by source client
- 8 Quicklinks – User support
- 8.1 A user’s certifications
- 8.2 A user’s event dates
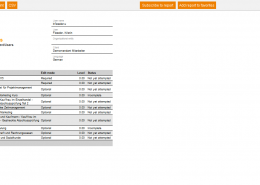
- 8.3 Current learning units
- 8.4 Event dates of the users in an OU
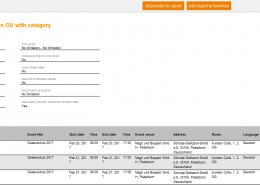
- 8.5 Event dates of the users in an OU with category
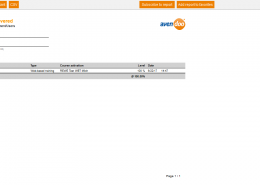
- 8.6 Learning content covered
- 8.7 Needs notifications for a user
- 8.8 Overnight stays at hotel per event date group
- 8.9 Recipient of a course announcement
- 8.10 Results for the knowledge test and assessment for a user of a category
- 8.11 User course activation status
- 9 Data Warehouse instruction via Power Query Editor
Reports

You see all dynamic reports on the overview page Reports, which are assigned to you via the Report templates . You also see all static reports. This page is even shown if if you got no author rights for reports like Read, Select, Change, Create, Delete (object permission) and/or Change external content via the Author assistant or Permission groups wizard.
You can edit the corresponding report via clicking the title.
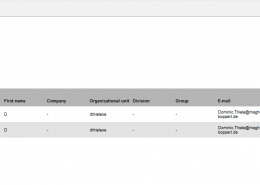
The overview table got the columns Title, Report category, Sub category, Report and User type. You can Edit display of columns and order via a right clicking the table header.
Furthermore there are the following filters available: Titel, Report, Report category, Language (Original language or other language) and Report type (All, Dynamic or Static).

You can open a report:
- by choosing the menu Reports → Reports and choosing a report out of the overview table or by filtering a report,
- via the widget My favorites or Reports to which I am subscribed and open single favorised or subscribed reports,
- by choosing Show report after choosing the context menu of the title in the overview, for example Learning content → Knowledge tests.
You open a report by choosing the report category first and then the subcategory. Now you can choose the single report of this category and you can open it via the button View.
Depending on the single report you get in the next step single filter options. The filters which are displayed on the left side are mandantory, because without them you cannot open the report. But also the filters on the right side make sense, because they restrict the retrieving amount of data. Thus reduces the loading time and on the other hand it makes the report clearlier laid out.
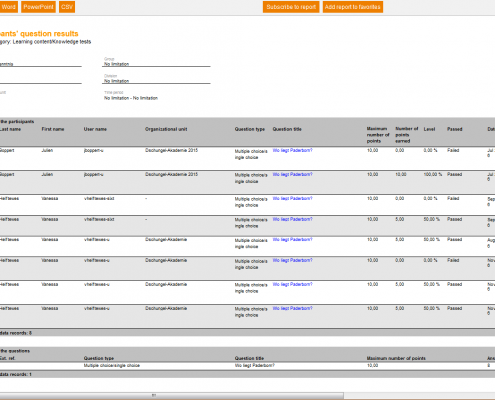
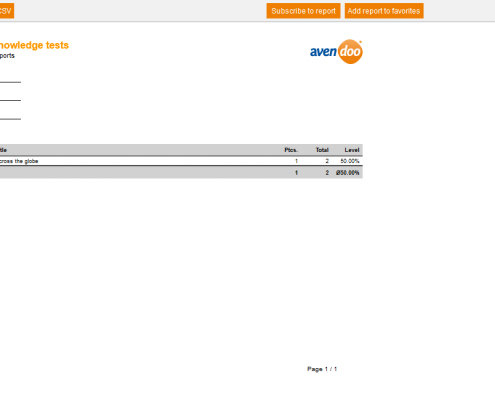
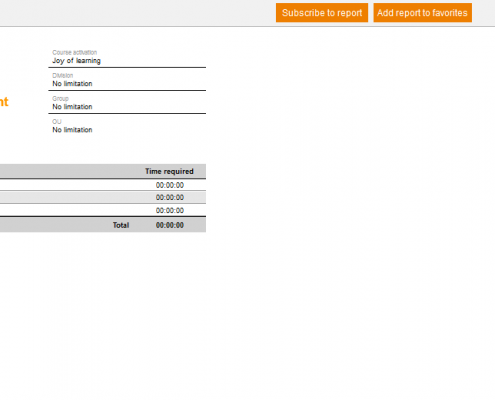
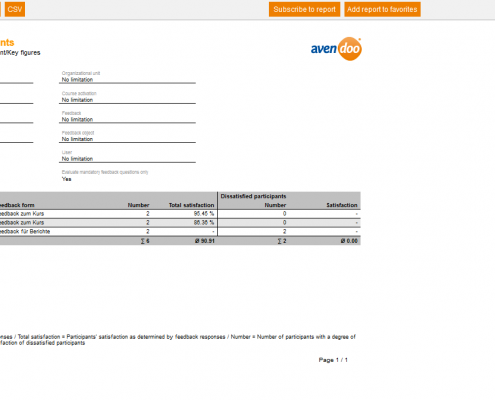
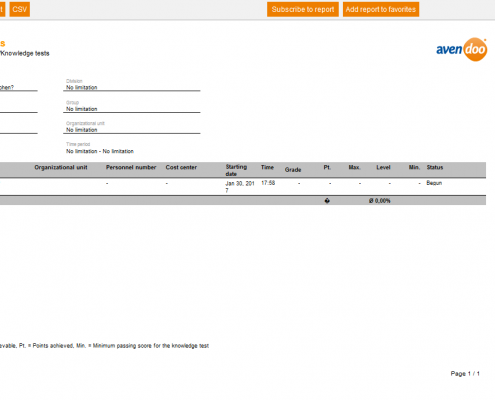
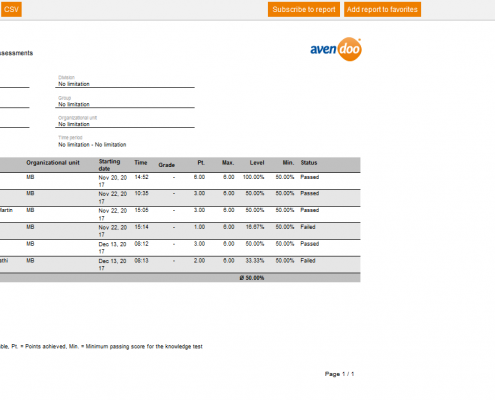
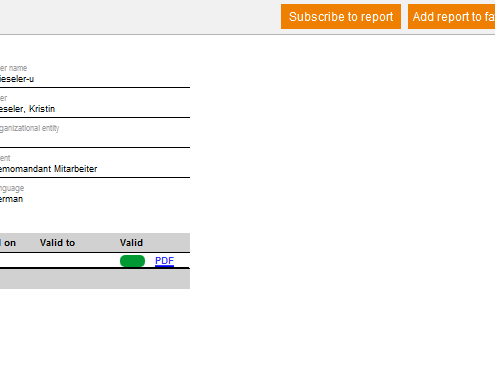
After setting your favored filters you can export the report into the appropiate format via the button PDF, Excel, Word, PowerPoint and CSV or you can open the report directly via Show in Avendoo®. After opening in Avendoo® there is an export via these buttons possible; you find the buttons now above the report. Furthermore you can subscribe to the report or you can add it to your favorites.
As team leader or user you can open the corresponding report in the Cockpit on the tab reports by clicking the title of the corresponding report in the list. Choose then the corresponding mandantory field and the optional fields and after that you click the button Show. To safe the report, you can click the buttons PDF, Excel, Word, PowerPoint or CSV. If the report is displayed, you can subscribe to the report or you can add the report to the favorites.
Static reports
Reports provide analysing information in Avendoo®. They got six categories, which have subcategories. Regarding the dynamic reports you can configure selected analyses by yourself.
Dynamic reports
Drill-down reports
How do I configure drill-down reports of static and dynamic reports?
Original report: Static report
If a drill-down report is possible for a static report, defines the author by assigning a report template to a permission group or to a user. The author sees the drill-down report templates intended on the list. The author can set single check marks.
In general: If the author assigns reports directly to the user (author, user or team leader), the user can open these. The user cannot select drill-down report templates on static report templates. This is only possible on dynamic reports.
Original report: Dynamic report
When the author has selected a static report as drill-down report in a dynamic report, the user can open the static report, if the user can open the superior dynamic report. This is also valid for the drill-down report from dynamic to dynamic. The user can open a report (static or dynamic) as drill-down, if the auhor has configured the drill-down report on a dynamic report template, which is assigned to the user – on the user or via a permission group. The user hasn’t to have a permission on a drill-down report.


Report favorites
You see also this page, if you got no author rights for reports like Read, Select, Change, Create, Delete (object permission) and/or Change external content via the Author assistant or Permission groups wizard.

Subscribe to report
If the report is displayed in Avendoo®, you see the button Subscribe to report in the middle above the report. Via this button you open the assistent for Regularly issued reports (see screenshot below).

Add report to favorites


Report templates
There is automatically a report template generated for each available report in Avendoo®. Authors with the appropriate permissions can edit these report templates or they can create new report templates. The author defines in a report template, which filter and data is available in the report. The author can create multiple report templates with different configurations for dynamic reports. So that the appropriate users can use the report template, you assign as author via the list view the appropriate report template to an permission group or you assign this via the User wizard. Also you can assign the appropriate report template to the permission group, which is also assigned to any user.
The single reports can be displayed in different file formats (pdf, Word, Excel, PowerPoint and CSV).
The Excel export of reports is configured to the current XLSX format and thus the limit is increased to 65,535 lines per table.

Avendoo® lists you the report templates of static reports and dynamic reports, if the access right Show, create and edit report templates was assigned on the tab Access rights in the Author assistant or on the tab Allocate author rights in the Permission groups wizard and this permission group was then assigned in the User wizard.
The report templates also have eight categories (learning content, event management, user management, course management, resources, clients, polls and use reports) and have analog to the reporting sub categories. This partitioning provides a better traceability of single report templates. You can show the single report templates in the corresponding favored file format (PDF, Word, Excel, PowerPoint, CSV file). Via the filter function you can search tightly focused for the corresponding report template.
Further information for creating report templates you find via clicking the box “New report template”.
New report template
Create a new report template or edit an already existing report template.
Training inventory
You can import training inventory entries via a CSV file. The import of this file is enhanced by the column classifications. Further you can select freely the location at all kind of training inventory entries.
You see the following columns in the overview of the training inventories: Title, Add to training inventory is set in the wizard User-defined fields.
You can filter by the following criteria: Title, Add to training inventory is set in the wizard User-defined fields. – These entries of the template are mandatory: username, title, type, startdate, enddate, location and provider.
If you’ve defined a
– You can use the OB3 API since version 17.47 for training inventory data.