This report shows you the users’ average answer per feedback question for a selected feedback form and the users’ comments and the frequency of the answers.
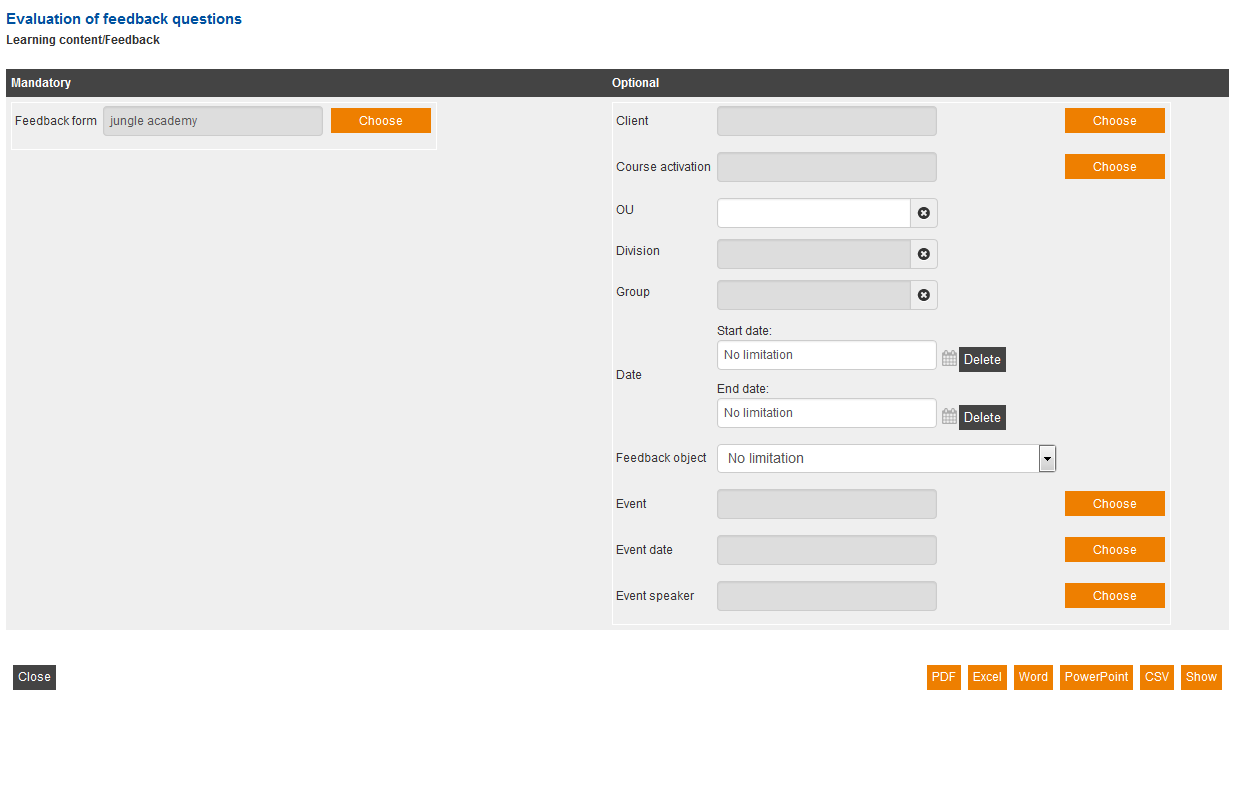
Mandatory
Choose the favored feedback form.
Optional
Specify the evaluation by doing the following entries:
- Client
- Course activation
- OU (OE)
- Division
- Group
- Date
- Start date
- End date
- Feedback object
- Event
- Event date
- Event speaker
Example for a report
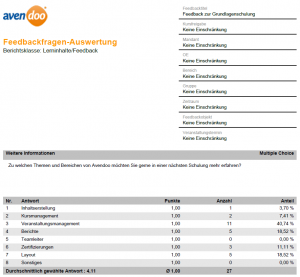
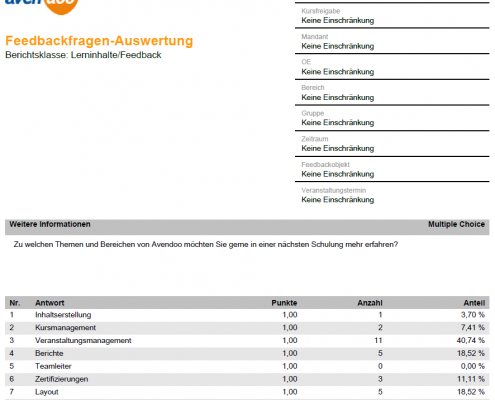
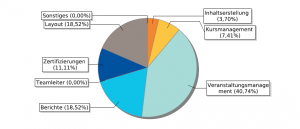
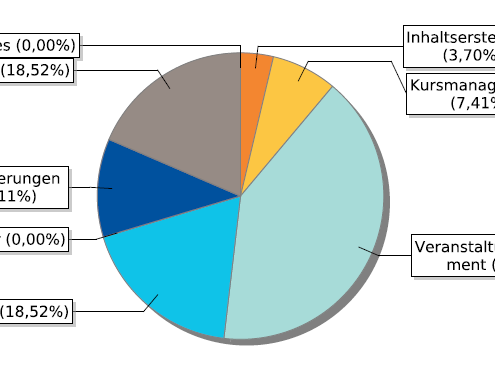
The report shows all possible filter options (feedback title, course activation, client, OU(OE), division, group, date, feedback object, event date). Then it shows per feedback question a table with the title of the feedback question, the question type and the question. Finally it shows a chart, which stands for the results.
No.
Represents per feedback question the order of the response options.
Answer
Shows the possible answers for the chosen feedback question.
Points
Shows the points, which are defined for the appropiate response option. More information about scoring system you can find in learning content → feedback questions.
Number
Represents the number how often the response option was chosen. At the end of the column you find the total sum ( Σ ) of the given answers.
Percentage
Represents the number, how often a response option was chosen, in per cent.
Average chosen answer
Shows the learner’s average chosen answer to the listed feedback questions.
Comment
Via click on the comment the corresponding Drill-down report “My feedback to the training” opens.
