Dynamic completion rates for training plans
This report provides an overview, how many learner have finished the training plan.

Required filters
Filter values that are required for requesting a report.
- Activation client
- Activation category
Optional filters
Filter values that are optional for requesting a report and for further limiting the results:
- Period created (period during which the training plans were drawn up)
- Start date
- End date
- Training plan
- Division
- Group
- Region
- Organizational unit
Report columns
Indicate which columns in the report should be shown. To do so, activate the desired report column by putting a check in the checkbox. To change the position of a report column, simply drag it to the place where you want to put it and drop it there.
Training plan
You can show the following entries for the column “Training plan”. Therefore set the checkbox in the appropiate line.
- Title
- Teasser
- Creation date
- Change date
- Change time
- Remark
Author
You can show the following entries for the column “Author”. Therefore set the checkbox in the appropiate line.
- User name
- Form of address
- Title
- Name
- Last name
- First name
- Company
- Organizational unit
- Division
- Group
- Street, building number
- ZIP code
- Town
- Country
- Phone
- Cell
- Cell phone (home)
- Defined 10, 11, 12, 13, 14
- Personnel No.
- Roles
- Language
- Gender
- Withdrawal date
- Withdrawal time
Information regarding participants
You can show the following entries for the column “Information regarding participants”. Therefore set the checkbox in the appropiate line.
- Number of participants
- Finished
- Level
Sorting
To arrange the evaluation results more clearly, you can define the sorting of the whole report and if the report should be sorted in descending or ascending order.
- No limitation or
- Sorting by chosen entry
Diagrams
Define if diagrams or logos should be displayed, for example to save space:
- Show logos
- Show header and filter data
- Show footer
- No group overview in CSV export
- Use fixed width in report columns
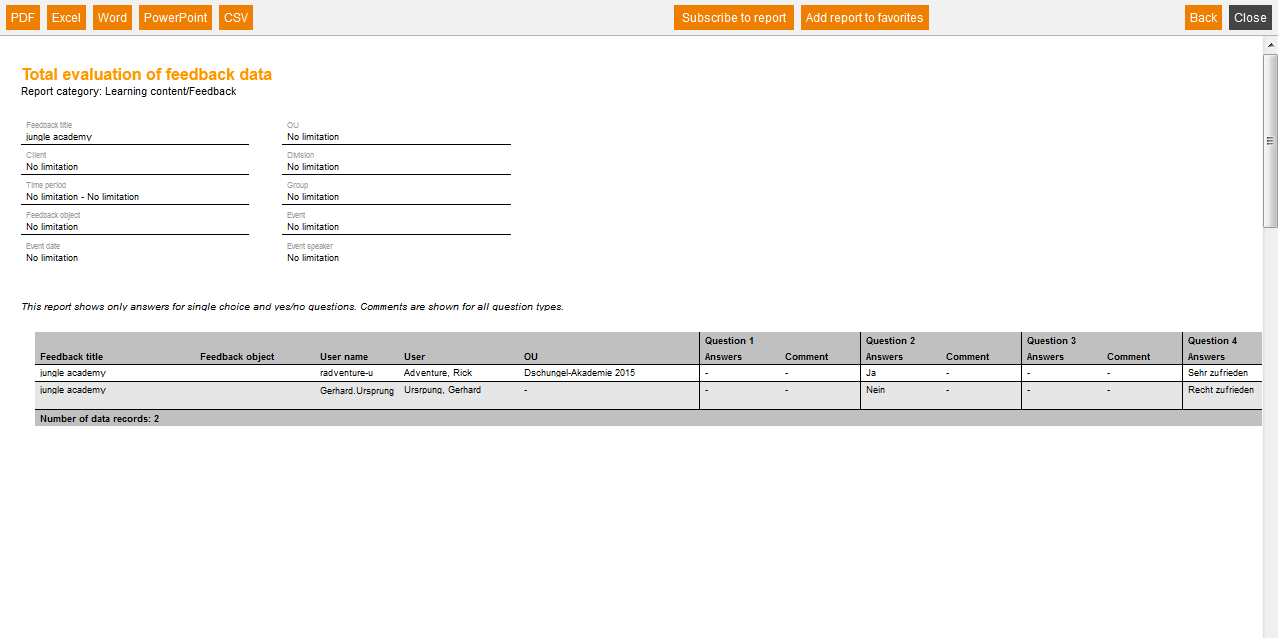
Example for a report
The report shows you your filter settings at first. Then you see a listing of the evaluation entries, which you have chosen individually in the report columns.